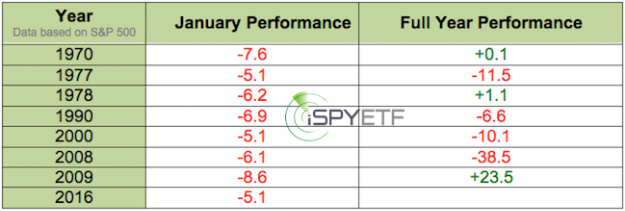
The S&P 500 ended January with a 5.07% loss. This is only the 8th time the S&P got hit with a January loss of 5% or more (since 1970).
The table below shows all 5%+ January losses and the corresponding full-year performance.
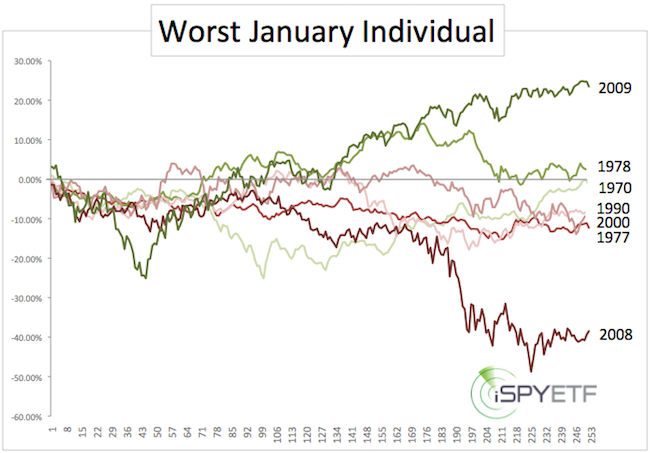
The chart below shows each individual year’s exact path from January – December.
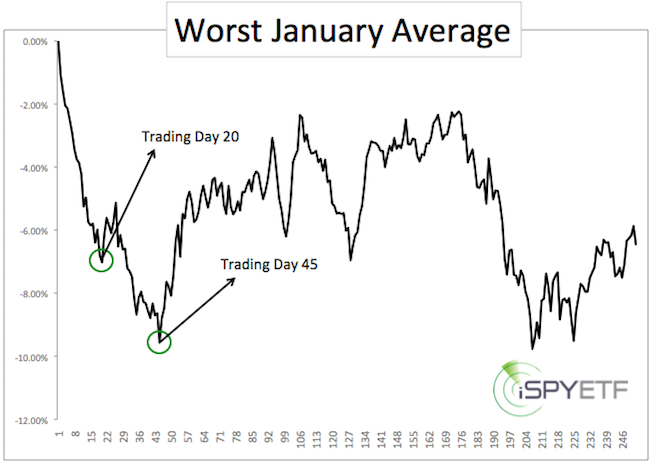
The next chart shows the average performance of the ‘worst Januaries.’ It might be worth noting that the initial low happened after 20 trading days. A brief bounce was followed by a more sustainable low around trading day 45.
Not to fudge the numbers, but one could argue that 2008 was an outlier year. Taking 2008 out of the equation, the year-end loss shrinks from 6.4% to 1.1%.
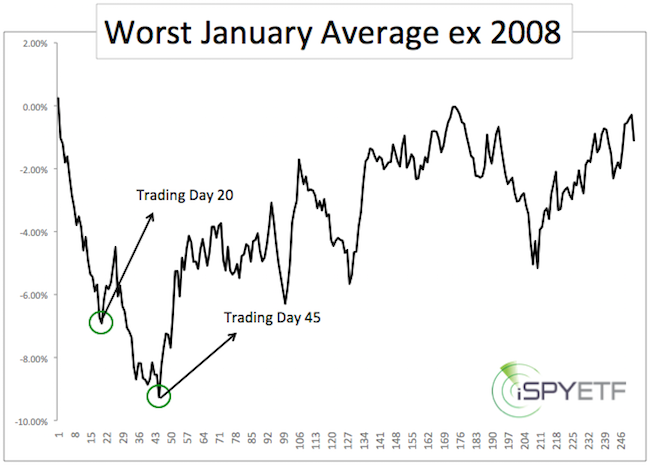
The pattern of a lower low after 45 days followed by a sizeable rally remains in tact.
Patterns like this don’t come with a predictive guarantee, but they provide some insight on how traders tend to react to certain events. Such patterns are one of many components that go into the Profit Radar Report forecasts and trading recommendation.
Simon Maierhofer is the publisher of the Profit Radar Report. The Profit Radar Report presents complex market analysis (S&P 500, Dow Jones, gold, silver, euro and bonds) in an easy format. Technical analysis, sentiment indicators, seasonal patterns and common sense are all wrapped up into two or more easy-to-read weekly updates. All Profit Radar Report recommendations resulted in a 59.51% net gain in 2013 and 17.59% in 2014.
Follow Simon on Twitter @ iSPYETF or sign up for the FREE iSPYETF Newsletter to get actionable ETF trade ideas delivered for free.


![]()