From the NAR: Existing-Home Sales Jump in January
Existing-home sales stepped out to a fast start in 2017, surpassing a recent cyclical high and increasing in January to the fastest pace in almost a decade, according to the National Association of Realtors®. All major regions except for the Midwest saw sales gains last month.
Total existing-home sales, which are completed transactions that include single-family homes, townhomes, condominiums and co-ops, expanded 3.3 percent to a seasonally adjusted annual rate of 5.69 million in January from an upwardly revised 5.51 million in December 2016. January’s sales pace is 3.8 percent higher than a year ago (5.48 million) and surpasses November 2016 (5.60 million) as the strongest since February 2007 (5.79 million).
In December, existing sales decreased 2.8 percent to a seasonally adjusted annual rate of 5.49 million in December from an upwardly revised 5.65 million in November. With last month’s slide, sales are only 0.7 percent higher than a year ago….
Total housing inventory at the end of January rose 2.4 percent to 1.69 million existing homes available for sale, but is still 7.1 percent lower than a year ago (1.82 million) and has fallen year-over-year for 20 straight months. Unsold inventory is at a 3.6-month supply at the current sales pace (unchanged from December 2016).
 Click on graph for larger image.
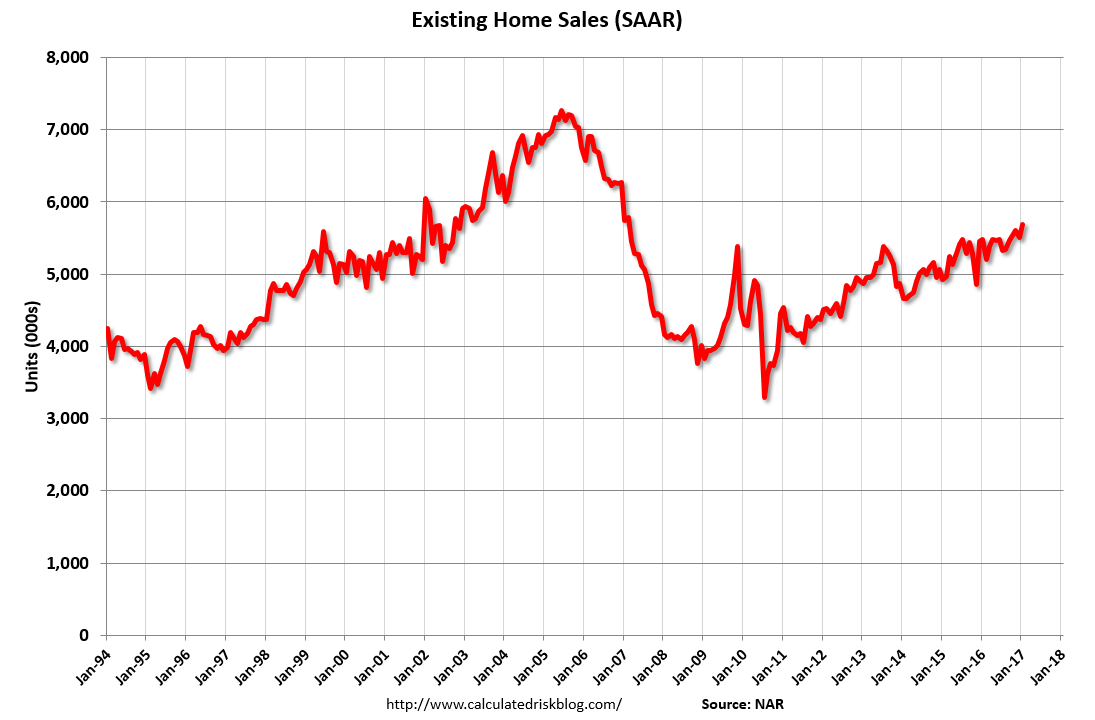
This graph shows existing home sales, on a Seasonally Adjusted Annual Rate (SAAR) basis since 1993.
Sales in January (5.69 million SAAR) were 3.3% higher than last month, and were 3.8% above the January 2016 rate.
The second graph shows nationwide inventory for existing homes.
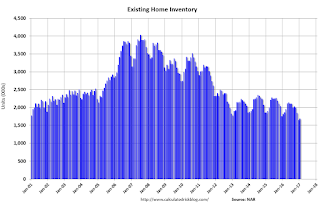 According to the NAR, inventory increased to 1.69 million in January from 1.65 million in December. Headline inventory is not seasonally adjusted, and inventory usually decreases to the seasonal lows in December and January, and peaks in mid-to-late summer.
The third graph shows the year-over-year (YoY) change in reported existing home inventory and months-of-supply. Since inventory is not seasonally adjusted, it really helps to look at the YoY change. Note: Months-of-supply is based on the seasonally adjusted sales and not seasonally adjusted inventory.
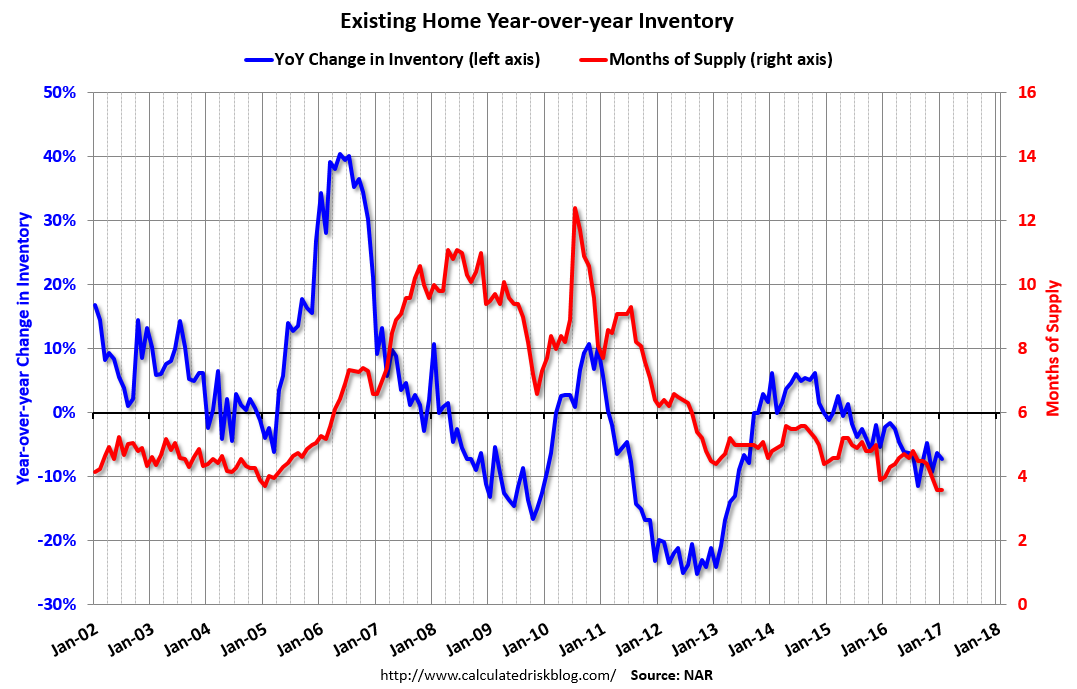 Inventory decreased 7.1% year-over-year in January compared to January 2016.
Months of supply was at 3.6 months in January.
This was above consensus expectations. For existing home sales, a key number is inventory – and inventory is still low. I’ll have more later …